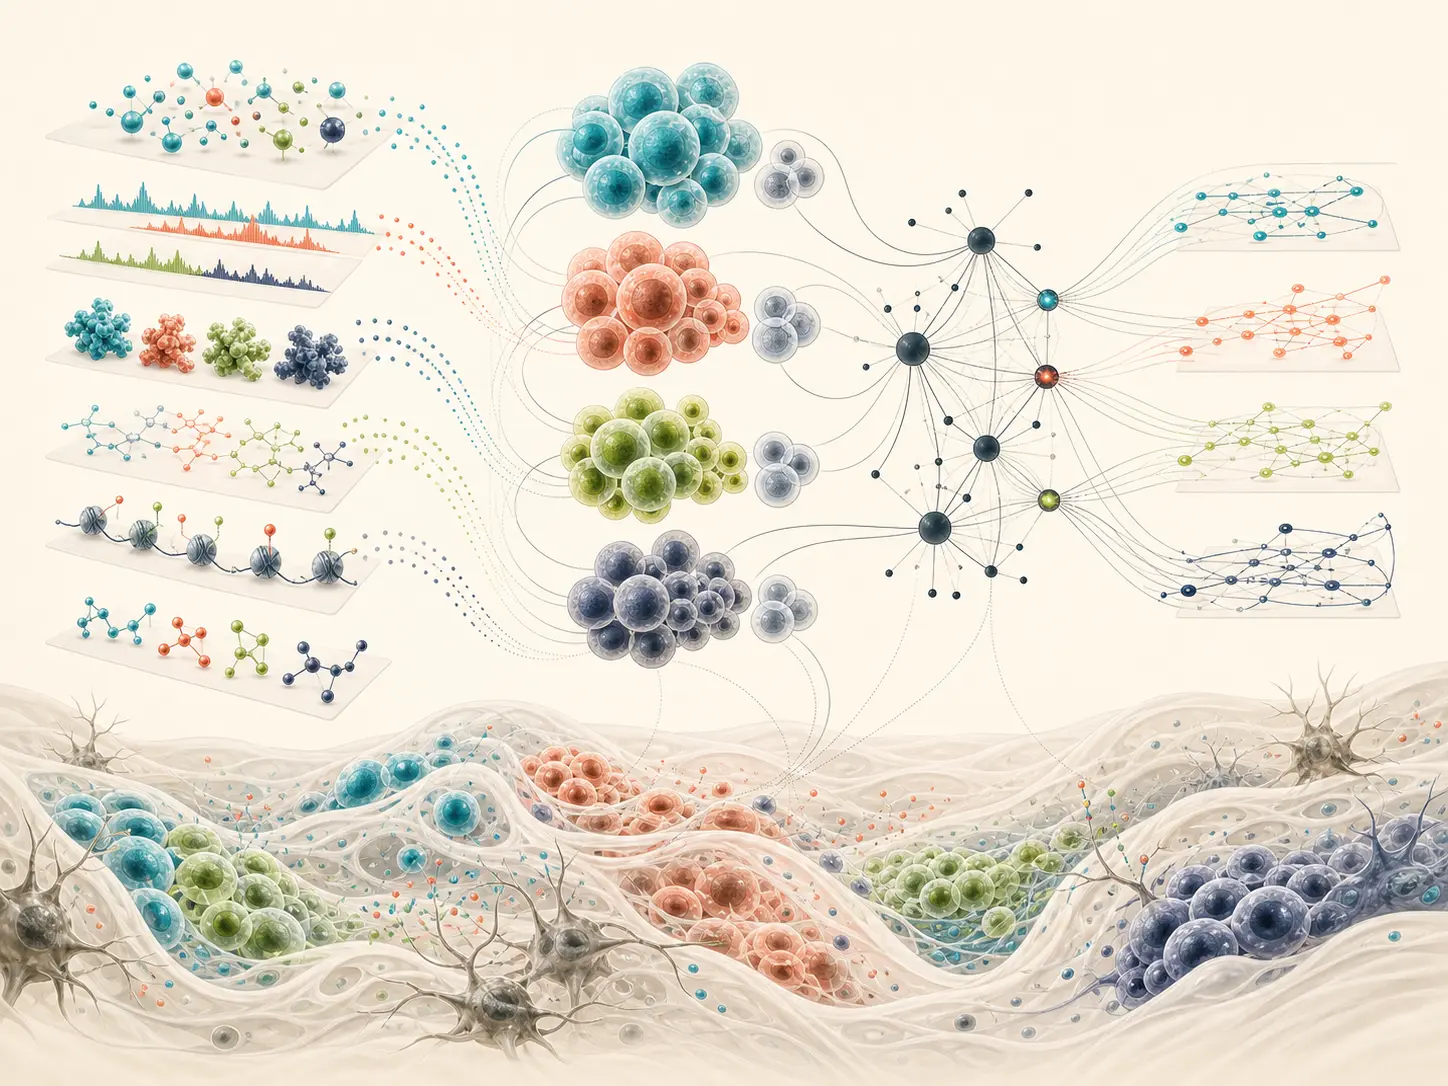
What Epigenomics analysis is designed to address
Epigenomics analysis is not a one-score software run. It is a reviewable analysis path organised around “Which regulatory regions are associated with the target cell state, treatment or phenotype?”, beginning with input quality, comparators and intended use of evidence before selecting an appropriate methodological level.
The work centres on Sequencing QC and alignment, Peak or differential-methylation analysis, Regulatory-element, motif and multi-omics integration and links Raw sequencing data or count matrices, Sample groups and batch metadata, Reference genome and assay type directly to QC and normalised outputs, Differential regulatory regions and annotation, Pathway, motif and candidate regulatory relationships. Reporting separates supporting evidence, conflicting signals, parameter dependence and conditions for follow-up validation.
Which regulatory regions are associated with the target cell state, treatment or phenotype?
Suitable research settings
- Projects that need to answer “Which regulatory regions are associated with the target cell state, treatment or phenotype?”
- Studies requiring consistent comparison and quality control across Sequencing QC and alignment and Peak or differential-methylation analysis
- Teams that need QC and normalised outputs, Differential regulatory regions and annotation, Pathway, motif and candidate regulatory relationships with complete reproduction records
Analyses included in the service
Sequencing QC and alignment
Apply Sequencing QC and alignment to raw sequencing data or count matrices and produce qc and normalised outputs. First confirm that raw sequencing data or count matrices can support the downstream analysis.
Peak or differential-methylation analysis
Apply Peak or differential-methylation analysis to sample groups and batch metadata and produce differential regulatory regions and annotation. Use consistent systems, conditions and naming across adjacent steps so comparisons remain reviewable.
Regulatory-element, motif and multi-omics integration
Apply Regulatory-element, motif and multi-omics integration to reference genome and assay type and produce pathway, motif and candidate regulatory relationships. Use consistent systems, conditions and naming across adjacent steps so comparisons remain reviewable.
Select the methodological level for the question
| Method | Best suited to | Watch for |
|---|---|---|
| Sequencing QC and alignment | Establishing the input baseline and initial search space for Epigenomics analysis | Errors in Epigenomics analysis input state, structure or data definition propagate through later steps |
| Peak or differential-methylation analysis | Comparing candidate states, features or mechanisms in Epigenomics analysis to form priorities | Epigenomics analysis comparisons require consistent conditions; raw scores are not experimental measurements |
| Regulatory-element, motif and multi-omics integration | Reviewing key Epigenomics analysis results, interpreting differences and recording uncertainty | Regional association is not regulatory causality; cell composition, batch effects and insufficient depth can affect interpretation. |
From question definition to reproducible delivery
Frame the research question
Use “Which regulatory regions are associated with the target cell state, treatment or phenotype?” to define comparators, decision use, experimental context and the strength of evidence the computation can support.
Review and curate inputs
Review Raw sequencing data or count matrices, Sample groups and batch metadata, Reference genome and assay type; resolve structure, naming, unit, batch or microstate issues and record any remaining assumptions.
Design methods and controls
Combine Sequencing QC and alignment, Peak or differential-methylation analysis, Regulatory-element, motif and multi-omics integration with controls, replicates, sensitivity checks or independent evidence, defining decision criteria before computation.
Compute with quality control
Run Epigenomics analysis, including Sequencing QC and alignment, in a reproducible environment; retain inputs, versions, parameters, logs and intermediate outputs, and flag convergence, sampling, data-quality and applicability issues.
Interpret and deliver
Organise QC and normalised outputs, Differential regulatory regions and annotation, Pathway, motif and candidate regulatory relationships while separating direct observations, model inference and working hypotheses, then prioritise experiments or follow-up computation.
What is needed and what is delivered
Inputs
- Raw sequencing data or count matrices
- Sample groups and batch metadata
- Reference genome and assay type
Optional supporting inputs
- Known positive, negative or reference systems for basic expectation checks in Epigenomics analysis
- Replicate experiments, external databases or literature evidence relevant to Epigenomics analysis
- Timing, compute, software-compatibility or delivery-format constraints for Epigenomics analysis
Deliverables
- QC and normalised outputs
- Differential regulatory regions and annotation
- Pathway, motif and candidate regulatory relationships
Quality control and interpretation limits
How results are reviewed
- Epigenomics analysis: Audit sample metadata, batches, missingness and confounders
- Epigenomics analysis: Use strict splits and compare with interpretable simple baselines
- Epigenomics analysis: Assess multiple testing, calibration, uncertainty and sensitivity
- Epigenomics analysis: Review with independent cohorts, external atlases or orthogonal experiments
Boundaries that remain
- Regional association is not regulatory causality; cell composition, batch effects and insufficient depth can affect interpretation.
- Epigenomics analysis results apply only to the recorded inputs, parameters, models and sampling scope. Changes to input state, comparison conditions or project objectives may require new computation.
Common ways projects begin
From one system to comparable candidates
When raw sequencing data or count matrices are available but decision criteria are inconsistent, establish baselines and controls, then use Sequencing QC and alignment, Peak or differential-methylation analysis, Regulatory-element, motif and multi-omics integration to build candidate tiers and deliver qc and normalised outputs with a difference analysis.
Independent review of existing results
When results relevant to Epigenomics analysis conflict, revisit raw sequencing data or count matrices and analytical assumptions around Sequencing QC and alignment, then add replicates, sensitivity checks or alternative models to distinguish signal from method conditions.
Questions before a project begins
What is required before Epigenomics analysis begins?
The minimum inputs are Raw sequencing data or count matrices, Sample groups and batch metadata, Reference genome and assay type. If information is incomplete, an input audit identifies which gaps change method selection and which can be handled as explicit assumptions.
Can the result directly prove “Which regulatory regions are associated with the target cell state, treatment or phenotype?”?
No single model output should be treated as experimental fact. Regional association is not regulatory causality; cell composition, batch effects and insufficient depth can affect interpretation. Quality controls determine whether results support a priority or mechanism hypothesis; key conclusions still require appropriate experiments or independent data.
Which reusable files are delivered?
Typical delivery includes QC and normalised outputs, Differential regulatory regions and annotation, Pathway, motif and candidate regulatory relationships, together with input-curation records, key parameters, software and database versions, quality-control results, editable figures and limitations. Exact raw formats are confirmed in the project plan.